Research Data Platform

The Entire Materials R&D Loop.

Collect, standardize, learn, and design — one cloud platform built for
materials research, not a generic data tool with an AI tab.

The Challenge

Research data is still
scattered everywhere.

Experimental data spread across spreadsheets, local files, and emails. Findings locked inside PDF tables and figures. The same property named three different ways by three different groups. D3Square connects all of it.

Fragmented Data

Experimental data scattered across tools, formats, and team members

Repetitive Experiments

Manually iterating experiments without data-driven guidance

Disconnected Analysis

Data collection, modeling, and optimization in separate environments

Knowledge Locked in Papers

Published results stay trapped in tables and figures nobody has time to transcribe

Inconsistent Terminology

Every group names the same property differently and writes units its own way

Platform

A three-stage pipeline,
with two capabilities alongside it.

Core pipeline

Collect

Experiments · Literature · Lab setup · Inventory · Buckets

Preprocess

Statistics · Correlation · Feature importance · SHAP

Train

No-code ML · Plain-language reports · Publish & predict

Running alongside

Knowledge Graph · Ontology

Extract entities from literature, standardize them against domain concepts, and query the graph from the chatbot.

Inverse Design

Start from target properties and let published models work back to the composition and process conditions.

AI Assistant — knows which page you are on and answers from your own data

Features

Precision tools
for every stage.

01

Literature Extraction

Register a paper by PDF, DOI, or PubMed ID — or subscribe to a journal and let new articles arrive on their own. D3Square reads the full text, then renders table and figure pages as high-resolution images so a vision model can read the numbers a text parser silently mangles.

  • Crossref and PubMed search, DOI import, scheduled journal feeds
  • Summary, key findings, entities, relations, and table data
  • Vision extraction at 200 DPI for tables, plots, and spectra
  • Every value carries its source page for one-click verification
  • Map extracted values straight into a data bucket column
PDF Vision AI · 200 DPI Table 2 · p.7
SampleSinter Tσ (mS/cm)
S-01850 °C12.4
S-02900 °C18.7
S-03950 °C15.2
Mapped to bucket column — conductivity
02

Ontology

Two labs measure the same property and the data still will not merge — different names, different units. Ontology concepts pull those variants together, normalize units to SI, and quarantine out-of-spec values before they reach your training set.

  • Concepts with synonyms, units, definitions, and hierarchy
  • Unit parsing and SI conversion, recorded with QUDT identifiers
  • New concepts and constraints go through review and approval
  • OWL reasoning derives implied relations, each keeping its evidence
  • TTL import/export and EMMO snapshot diffing for interoperability
ionic conductivity σ_ion 이온전도도 IonicConductivity ontology concept S/cm QUDT unit range rule quarantine inferred  ·  Sample S-02 → hasProperty → IonicConductivity rule: transitive  ·  source relations retained
03

Knowledge Graph

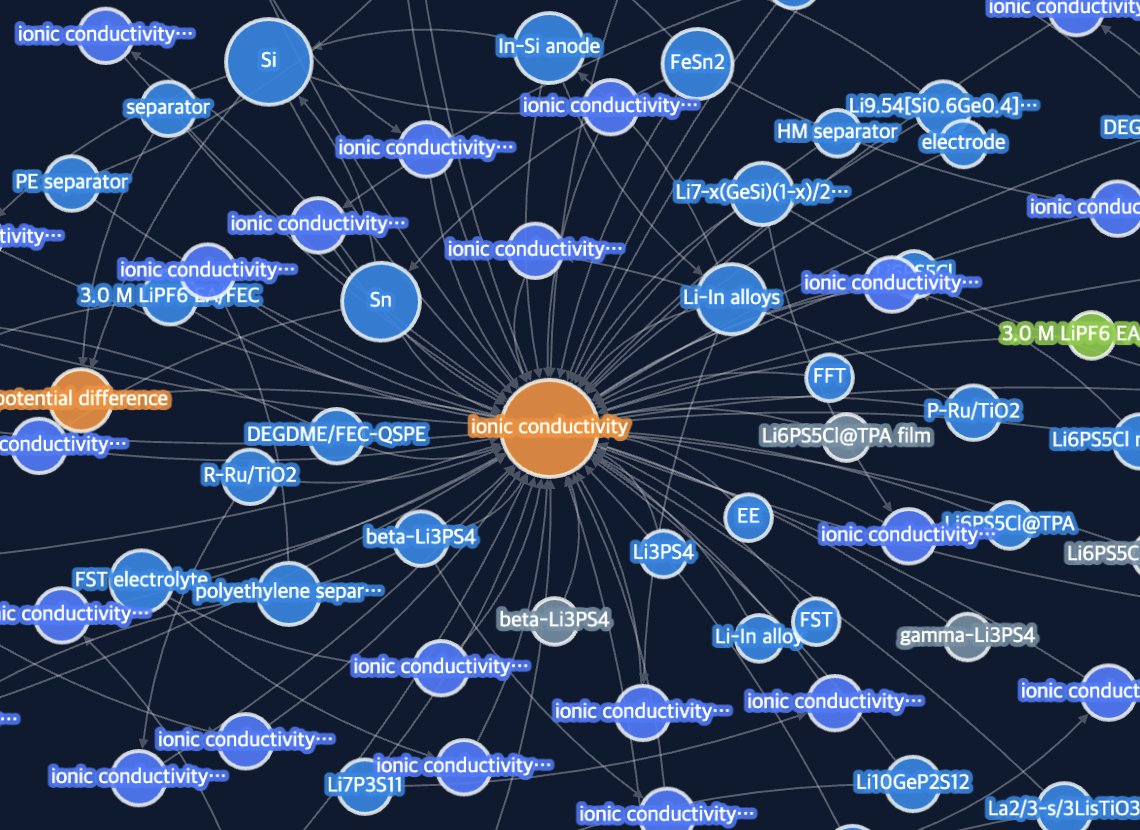
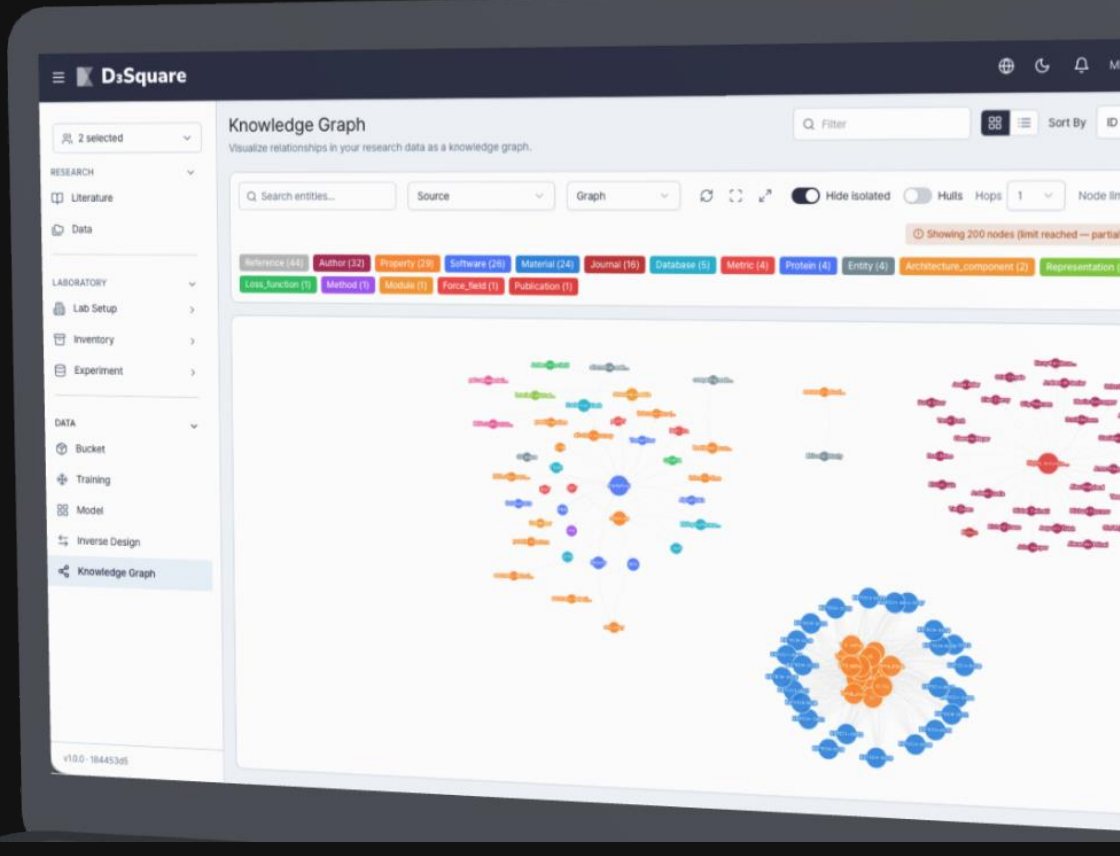
The entities and relations pulled out of your literature land in a graph you can actually look at. Filter by type, follow a relation, hand the result to the chatbot — or send the selection straight to a training bucket.

  • Entities typed as material, property, method, journal, author, and more
  • Filter by type, hide isolated nodes, expand by hops
  • Ask the assistant and get answers grounded in the graph
  • Export a graph selection to a data bucket for training
  • Results respect data permissions — no access, no evidence
Knowledge graph view in D3Square showing typed entity clusters and their relations

Knowledge Graph — entities typed and clustered, filtered live

04

Data Buckets

Upload experimental datasets and validate them automatically. Handle missing values, categorical encoding, and outlier detection in a single preprocessing pipeline.

  • Automated data validation and error detection
  • Missing value and outlier preprocessing
  • Correlation analysis and visualization
  • Version control and history restoration
TemperaturePressureYieldDensity
1,2403.294.17.85
1,18091.77.82
1,3103.596.37.91
1,2753.395.07.88
1,1953.192.47.83
Validated — 1 missing value detected
05

Model Training

Train models straight from a bucket without writing code. Compare runs on R², MAE, and RMSE, then read what the model actually learned — the platform writes the interpretation out in plain language, cautions included.

  • No-code training: GPR, XGBoost, linear models, deep learning
  • Cross-validation and side-by-side comparison on R² · MAE · RMSE
  • SHAP feature importance, with the top drivers called out
  • Plain-language result report: summary, key findings, cautions
  • Publish to the Prediction tab, ready for prediction and inverse design
Training result report in D3Square: summary, key findings, important features, and cautions written in plain language

Training Result Report — summary, key findings, top features, and cautions, written out for you

06

Inverse Design

Define the target properties first and let published models work back to the composition and process conditions that meet them. Five steps — import a model, map its roles, set the design variables, search, run.

  • Single and multi-objective runs on published models
  • Genetic algorithm, Bayesian optimization, grid and random search
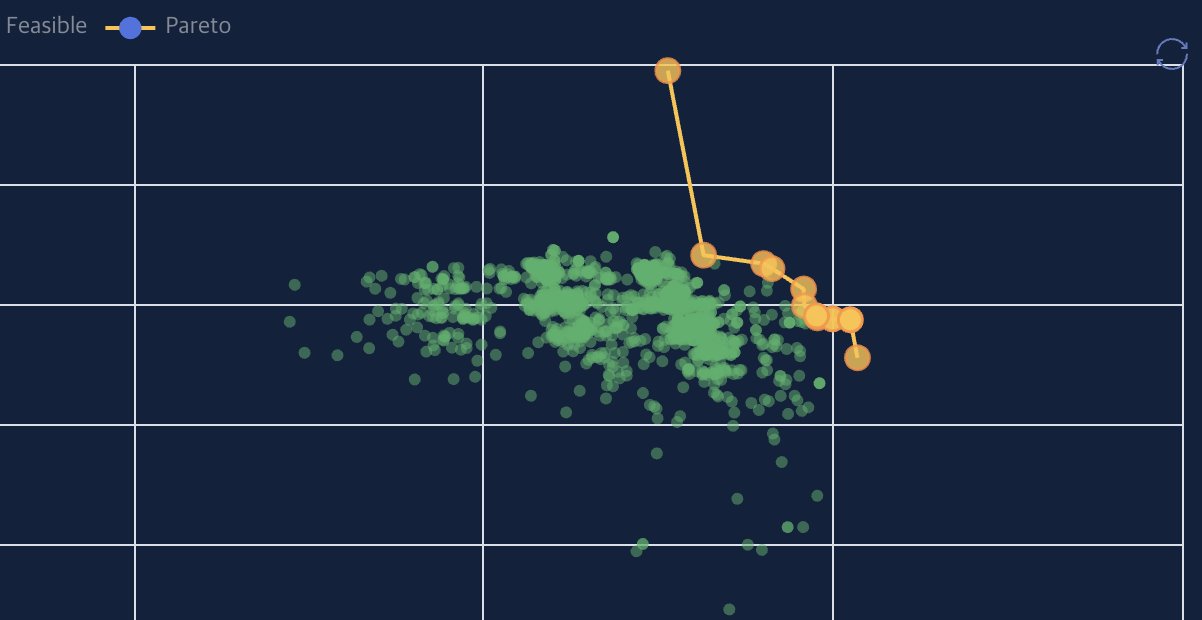
  • Pareto front proposes the candidates worth making
  • Constraint-bounded exploration of the design space
  • Sessions, runs, and results kept per project
Objective 1 (minimize) Objective 2 (maximize) Pareto Front
07

Active Learning

Recommend the optimal next samples to measure. Maximize information gain with minimal experiments, reducing research cost and time.

  • Expected Improvement / UCB strategies
  • Thompson Sampling-based recommendation
  • Iterative model refinement cycles
  • Minimized experimental cost
Train Model
Find Uncertainty
Suggest Samples
Run Experiment
Iterative Refinement
08

AI Assistant

The assistant knows which page you are on. On a training run it offers to compare performance; on the knowledge graph it answers from the graph; on the dashboard it tells you what moved. Ask it to do the work and it operates the platform for you.

  • Page-context aware — proposes the next step for the screen you are on
  • Hybrid retrieval: vector search over documents plus graph traversal
  • Runs platform actions: buckets, training, models, inverse design, CAE, DOE
  • Multilingual questions searched in both the original and translated form
  • Answers scoped to what your account is allowed to see
Dashboard
Morning — want today’s research briefing?
Training
Two runs finished. Compare their performance?
Knowledge Graph
Three papers link this method to conductivity. Show them?
Answers cite the documents and graph nodes they came from

Workflow

From lab bench
to optimal design.

Step 1

Import Literature

Bring in papers by PDF, DOI, or journal feed. Text, tables, and figures come out with their source pages attached.

Step 2

Standardize

Match extracted terms to ontology concepts, normalize units to SI, and quarantine values that break the rules.

Step 3

Collect Data

Upload experimental datasets to buckets with automated validation and preprocessing.

Step 4

Explore & Analyze

Run correlation analysis, scatter plots, and distribution analysis to understand data structure.

Step 5

Train Models

Compare multiple algorithms and select the best predictive model for your targets.

Step 6

Deploy & Predict

Publish validated models and use them for predictions on new experimental conditions.

Step 7

Optimize

Run multi-objective optimization to find the optimal design parameter combinations.

The Shift

What changes once
the platform is in place.

BeforeWith D3Square
Files on personal PCs, spreadsheets, and disconnected systems
Data management
Experiments, literature, and analysis records accumulating on one platform
Insights leave with the project — and with the person
Literature use
A knowledge graph structured by domain ontology, queryable by anyone
Specialists write code in separate environments
Model training
No-code training with plain-language interpretation the whole team can read
Conditions found by running the experiment again, and again
Candidate search
Target properties drive inverse design, which proposes the conditions

Why D3Square

Not a generic data tool.
An R&D operating platform.

Experiments, inventory, literature, properties, and process conditions are handled in context — not as anonymous columns in a spreadsheet.

End-to-End Connection

Collection, analysis, learning, prediction, and inverse design are one platform, not five tools stitched together.

Materials-R&D Specific

Experiments, inventory, literature, properties, and process conditions are first-class objects with the right fields and units.

Explainable AI

Performance metrics, the variables that drove them, and the caveats worth knowing — written out in plain language.

Reusable Knowledge and Models

Structured literature knowledge and trained models become the starting point for the next project instead of one-off artifacts.

The difference is not any single feature. It is the loop — data, knowledge, and models that keep reinforcing one another.

Collect

Every research input,
in one place.

Lab setup, inventory, experiment design, and literature are captured in one connected workflow, then grouped into buckets the team can version, share, and train on.

Lab Setup screen listing locations, equipment, and analysis templates
Lab SetupStandardize locations, equipment, protocols, and analysis templates.
Inventory screen tracking quantity and history of materials and mixtures
InventoryTrack quantity and history for materials, mixtures, and specimens.
Experiment designer showing an experiment built as connected nodes
ExperimentsDesign experiments as connected nodes, and record what actually happened.
Literature reader with highlights and extracted data labels
LiteratureGather papers, read them in place, and turn highlights into data.
Permission-scoped bucketsData is shared on purpose. What a user cannot open is also excluded from graph queries and AI answers.
Versioned team assetsBuckets keep their history, so a dataset used for training can be restored and re-checked later.
API and LIMS integrationConnect existing lab systems so collection keeps running without anyone re-typing it.

Use Cases

Built for diverse
research domains.

Materials Science

Optimize alloy compositions and heat treatment conditions to achieve target material properties.

Chemical Processes

Systematically explore reaction conditions and catalyst configurations to maximize yield.

Manufacturing QC

Build quality prediction models from process data and maintain optimal operating conditions.

Energy Research

Systematically manage experimental data for battery materials, catalysts, and energy systems.

Ready to transform
your research workflow?

We welcome inquiries about deployment, demo requests, and technical consultations.